Case study / 2025
Fintech Analytics Dashboard
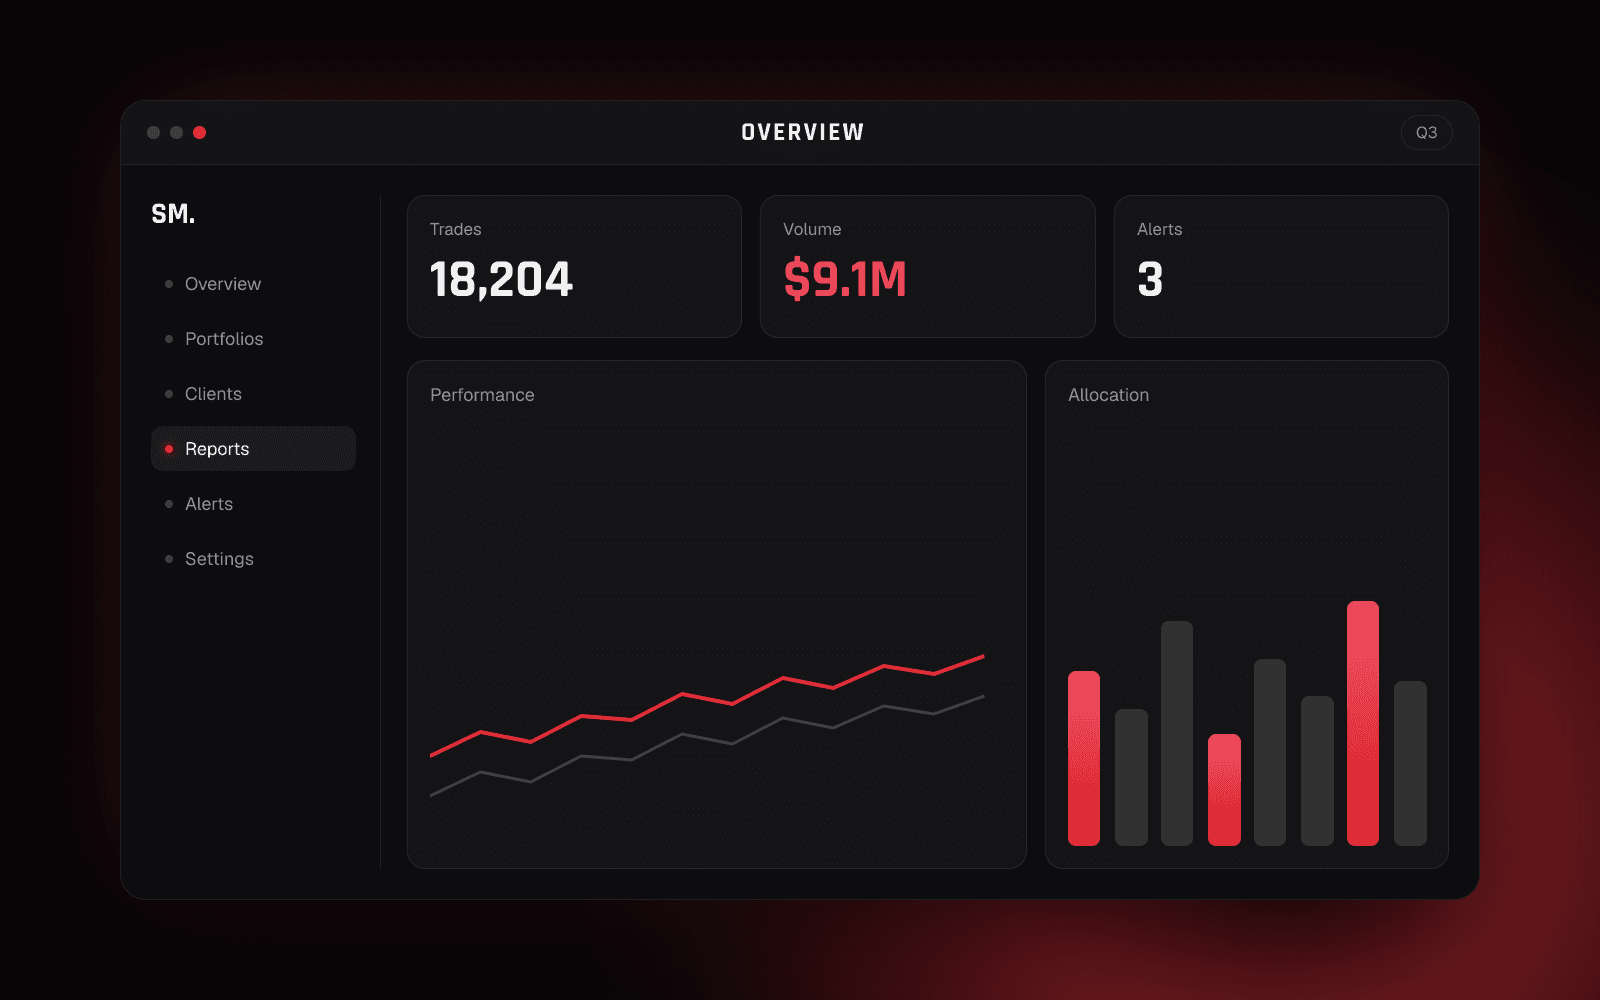
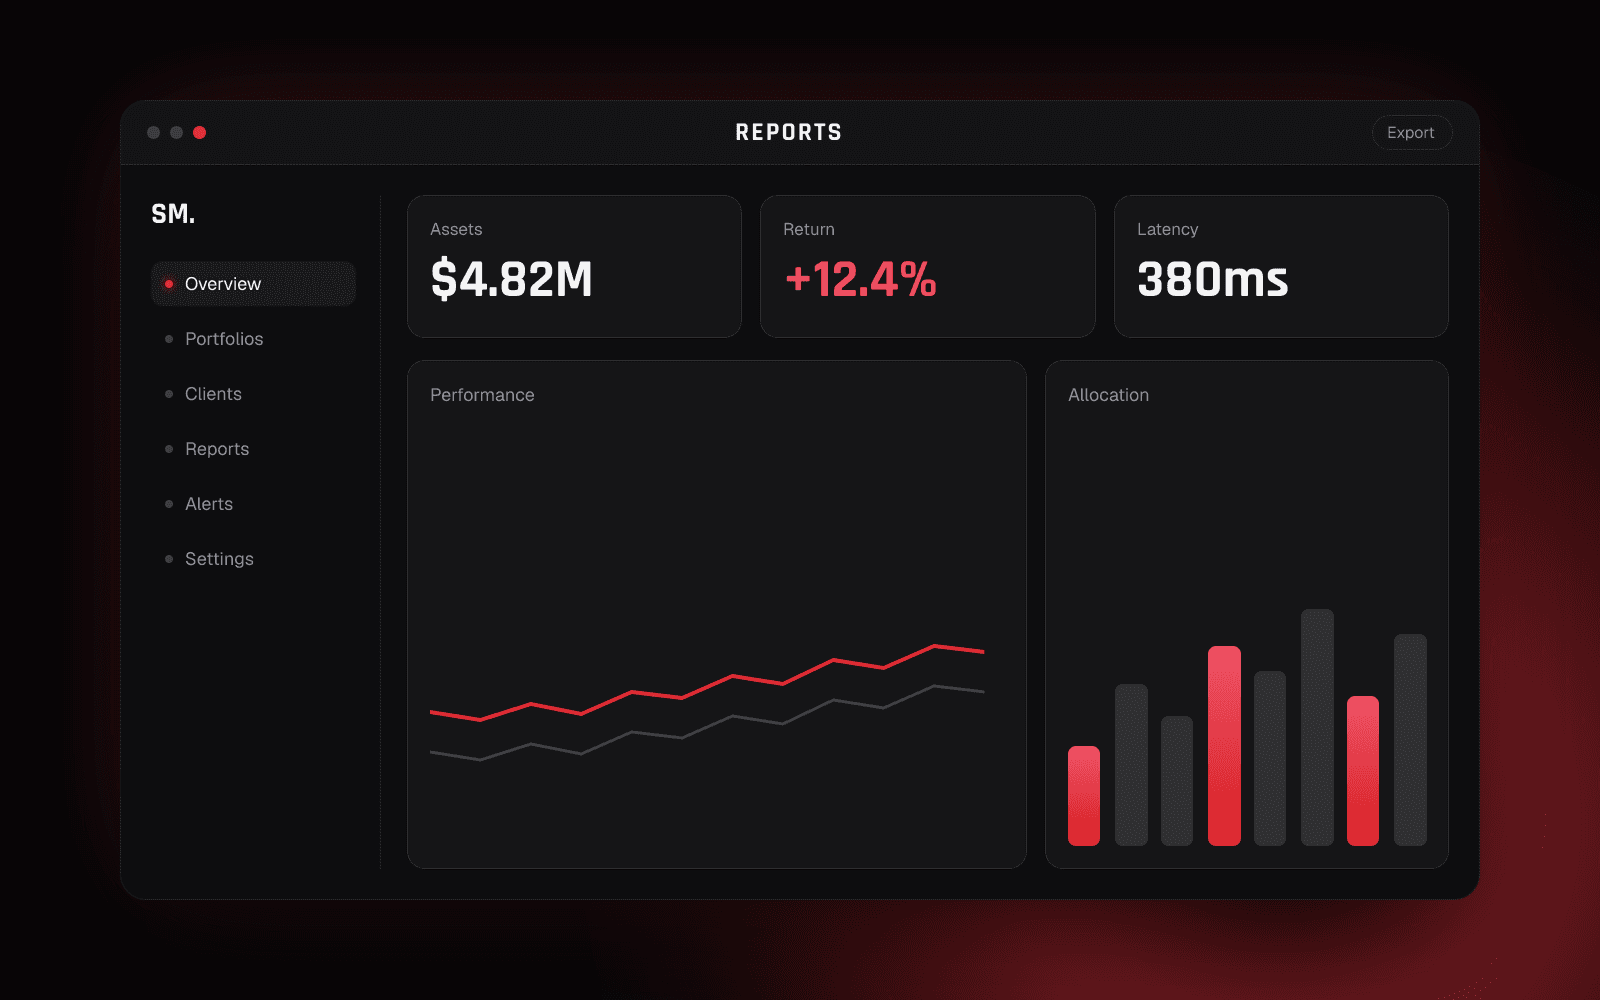
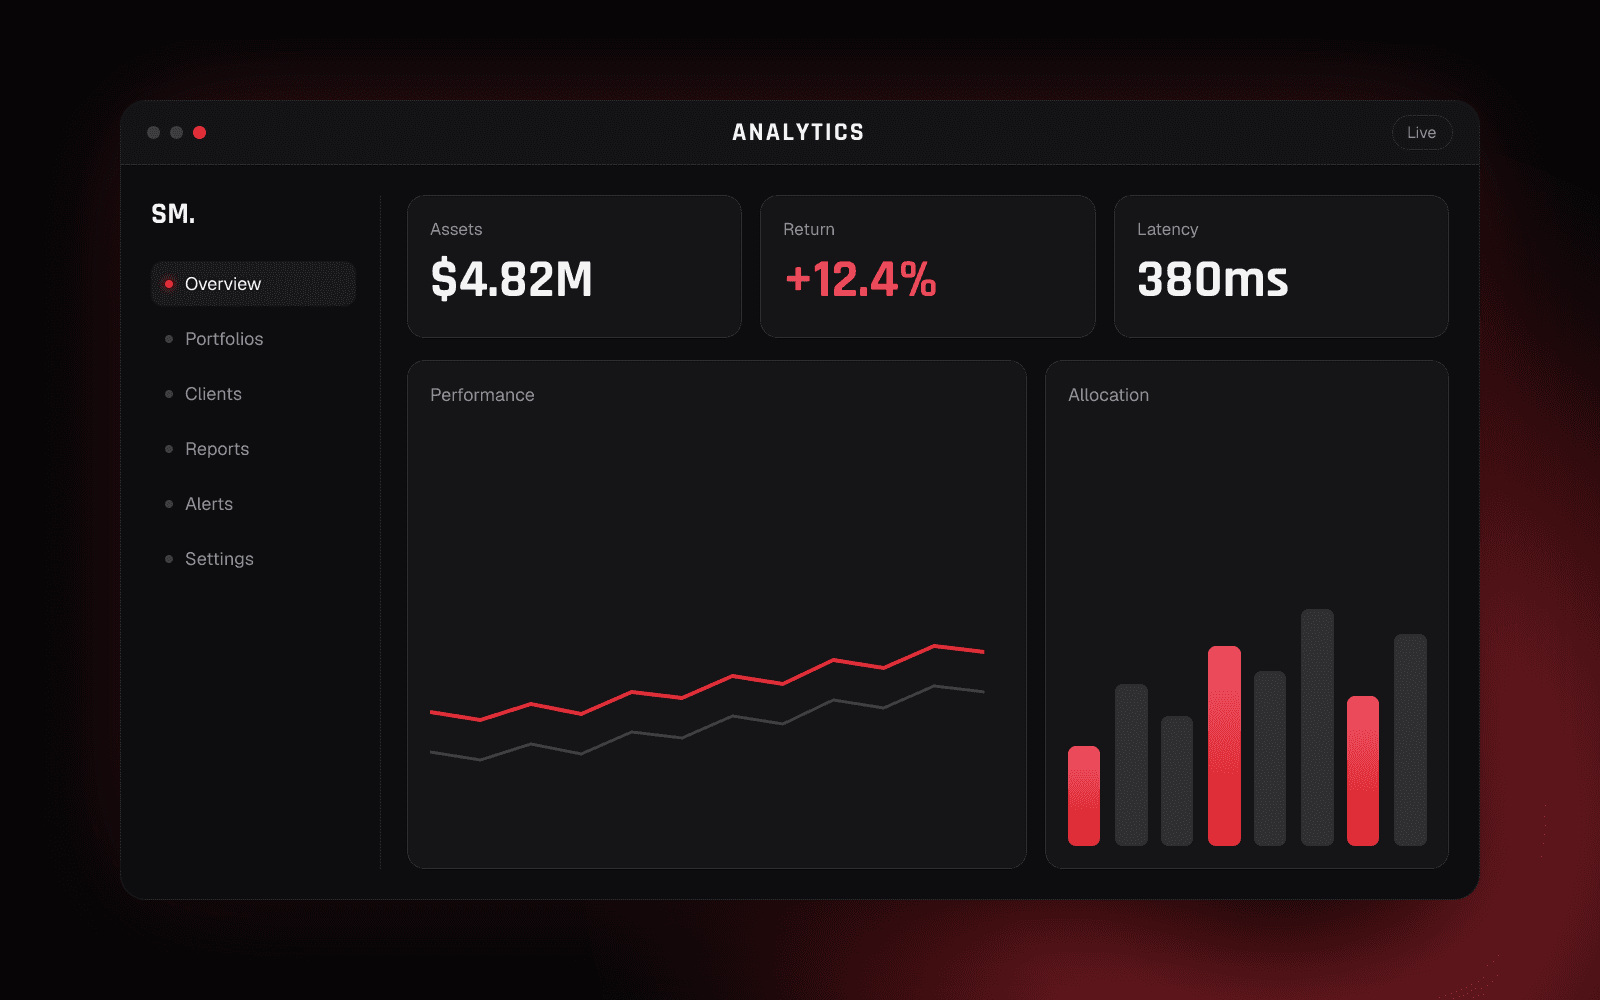
Real-time portfolio analytics for 10k+ daily users.
- Role
- Lead fullstack developer
- Client
- Enterprise client via Simform
- Timeline
- 5 months
- Year
- 2025
01The problem
Reporting ran as nightly batch jobs, so advisors started every morning with data that was already twelve hours old. Any ad-hoc question became a ticket for the data team.
The goal: live numbers, sub-second filtering across millions of rows, and an interface advisors would choose over their spreadsheets.
02What I owned
Requirement workshops with the advisory team
PostgreSQL schema, materialised views and query plans
Next.js app, Node.js realtime worker and the release plan
03The solution
Discovery started with the twenty questions advisors asked most. The schema and materialised views were designed around those questions before any UI work.
Next.js Server Components stream the heavy aggregates, a Node.js worker pushes deltas over WebSockets and Prisma keeps the data layer typed. Claude Code sub-agents drafted and verified migrations while I focused on query performance.
04Impact
Of data lag removed
p95 filter latency
Daily active users
05Stack
- Next.js
- TypeScript
- Node.js
- PostgreSQL
- Prisma
- WebSockets
- AWS